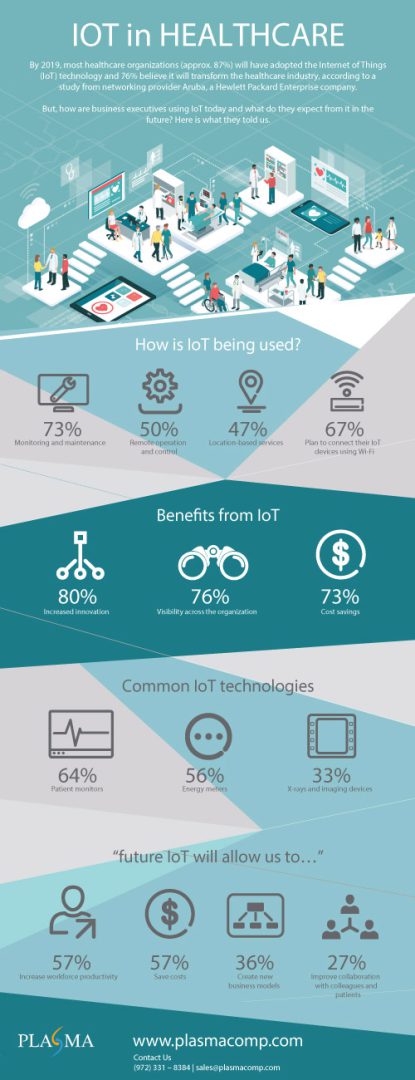

Data visualization is the presentation of data in a graphical format. This enables decision makers to see the analysis presented on screen: clarifying concepts and identifying new trends. Data visualization can also explain which factors impact customer behavior. It identify parts that need more attention for improvement and help you understand which products to place where. Benefit of data visualization is to manage influxes of new information and makes it easy to find trends. It easily recognize your next steps from these visual trends and can save hours of time. It brings important relationships between business conditions into focus. If you’re looking for your next data visualization solution, Contact Plasma Inc. Our data visualization solutions combined with powerful yet approachable analytics to help companies improve their growth strategies efficiently.


